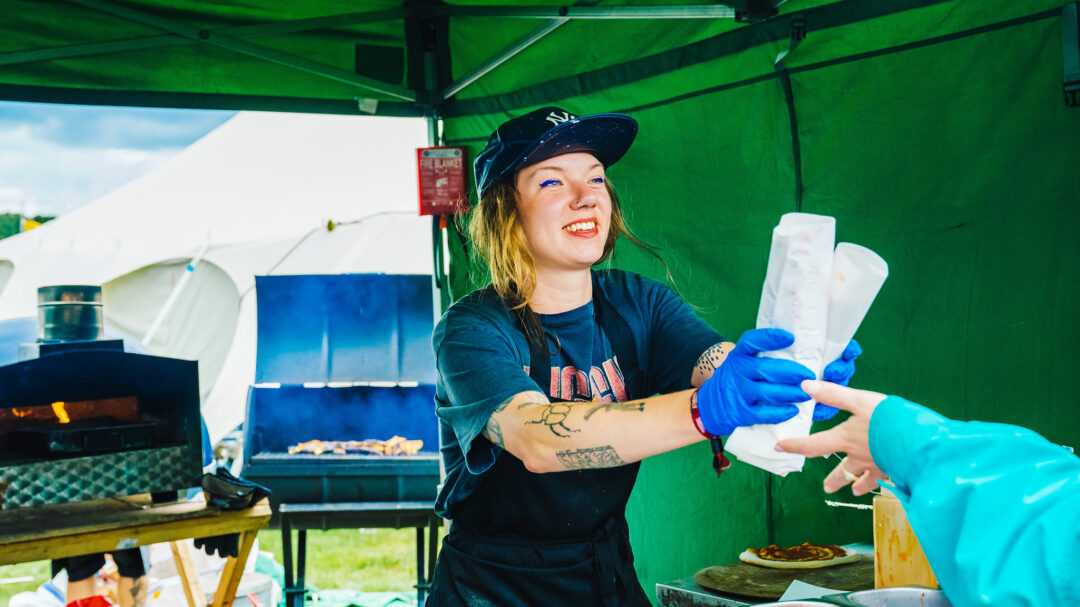
Our flagship event, Shambala Festival, welcomes over 20,000 people a year, including crew and artists. We identified that one of the best ways to slash our footprint was to go meat & fish free in 2016 (more on that here). This continues to save us an estimated 100 tonnes CO2 a year – pretty tasty.
But we wanted to do deeper, and figure out the exact impact of the food we serve on site, to enable us to:
- Identify high-impact areas of our trader and crew catering menus
- Reduce our emissions by finding low-carbon alternatives
- Set a benchmark for improvement year on year
- Find the average footprint of a meal served at the festival
We discovered that our festival food footprint was 54.1 tonnes of CO2e*.
(*CO2e = a measure that was created by the United Nations’ Intergovernmental Panel on Climate Change (IPCC) in order to make the effects of different greenhouse gasses comparable. It describes the global warming potential of any and all greenhouse gas in one metric.)
…and here’s how we calculated it..
DATA COLLECTION
Step 1: Carbon footprints
We asked our amazing food traders and our epic crew catering company (Henry’s Beard) to enter every dish they served into a carbon-mapping software called Klimato, adding each ingredient individually by weight and suspected origin.
Challenges: We had 75% of food traders add their ingredients, with 245 meals in total logged. This took quite a lot of chasing and checking-in, which was time-intensive. However this allowed us to form close relationships with the food trucks we work with. Over time, this has been so beneficial as we journey toward more sustainable, regenerative food systems together…
Step 2: Sales data
We asked Food Traders to offer their POS data (point of sale) so we had the exact amount of dishes sold. We could then multiply the Klimato CO2e data by the amount of each meal sold. This gave us a full picture of the food footprint from actual sales at Shambala.
Challenges: It was more difficult to obtain this information than we expected – as some food traders worried we were really wanting to poke around their financials so we could increase our pitch fees! Once we spoke to them authentically about this concern, and our intention to gain greater transparency on our food footprint, they were way more compliant. 67% offered us their sales data.
DATA ANALYSIS
Step 3: Total festival food footprint
To arrive at an educated guestimate for all of the trader dishes – including those who didn’t submit their carbon data – we took the data we had (75% of carbon information and 67% of sales data) and extrapolated it out to account for 100% of the meals. Once we had each of these figures, we simply divided the total CO2e footprint by the amount of dishes sold.
We found that Food Traders accounted for 48.76 tonnes based on 90,185 meals sold + Crew catering which created 5.34 tonnes for 7,952 crew meals made. This totalled 54.1 tonnes of CO2e.
Average kg CO2e per meal
To find the average footprint per meal we segmented the dishes that constituted full meals (as opposed to snacks and drinks only). We made this decision to collect an average kg of CO2e for each dish that matched the One Planet Plate initiative – which suggests that an entire meal for dinner / lunch should be within 0.5 kg CO2e.
We exported all these dishes from Klimato and found the average to be 0.43kg CO2 per dish. However, when we used the actual sales data to calculate a CO2e per dish, this figure jumped to 0.54kg CO2e. This was because our audience were choosing more of the high carbon, cheese-heavy meals. This has encouraged us to think more about labelling carbon impacts on menus more clearly, and using nudge techniques to encourage audience to choose lower-carbon dishes.
Extra analysis
By looking at the details of each meal entered into Klimato individually, we could analyse data quite closely. We found that nearly one third of dishes, 71 of 245 (30%), were over the One Planet Plate 0.5kg CO2e target. All these dishes contained dairy cheese, rice or soy protein. Other surprise ingredients of high carbon were sunflower seeds, hummus, tahini and cooking oils.
Recommendations
To find your own festival or event food footprint:
- Find a good carbon monitoring partner – Klimato are great and have helped 484 partners in 11 countries save 8,712 tonnes of CO2e in 2022.
- Work closely with your Food Traders to join you on the journey to climate-conscious cuisine. Their buy in is essential.
- Monitor inputs closely, because what gets measured gets managed! Make sure everyone is aware of data you’re looking to capture as early as possible.
- Contact Kambe for more support! We’ve been at it for 23 years, and have tried and tested trials and triumphs to share!